Build a thermodynamic cycle by dragging state points on a PV diagram, then see the work, heat, and efficiency that result.
What you do in this lab
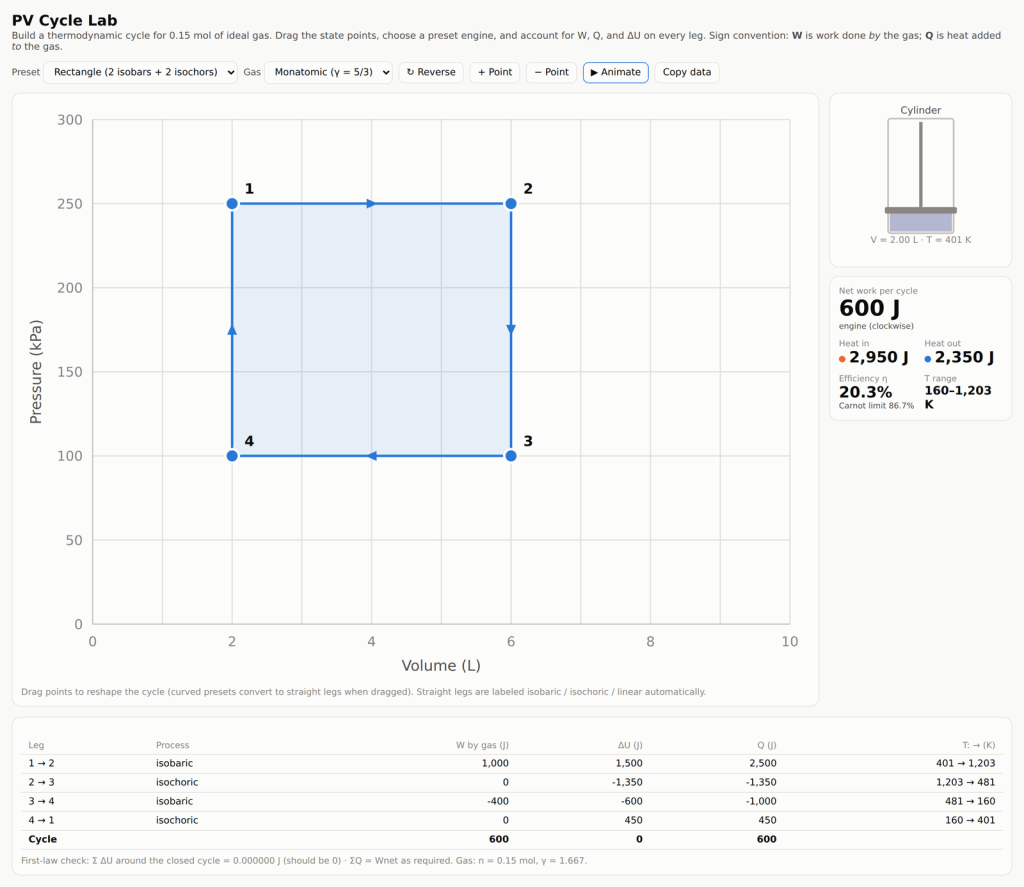
You place and drag state points to define a closed cycle on the pressure–volume plane. As you move each point, the simulation recalculates the path segment by segment: the work done on or by the gas, the heat exchanged, and the change in internal energy. Closing the loop gives you the net work and the thermal efficiency of the engine you just designed.
Because the numbers update as you drag, it is a fast way to build intuition for why some cycles are more efficient than others, and to test predictions before committing them to paper.
Before you start
The lab opens in a new tab and runs entirely inside your browser. Nothing is uploaded, nothing is stored, and no account is needed. It works on a laptop or a tablet; a larger screen makes the diagram easier to work with.
Direct link: brandoncomella-afk.github.io/physics-sims/pv-cycle-lab.html

